Difference between revisions of "Data organization in spreadsheets"
m |
(No difference)
|
Latest revision as of 09:07, 8 January 2021
Purpose
Spreadsheet software (such as Microsoft Excel, Google Sheets and LibreOffice Calc) is commonly by scientists as tool to store, to analyze and display data. While this one-in-all package is convenient for many, there are many drawbacks and even danger to accidentally alter results or data without knowing. Second, having raw data, secondary data, analyses and graphs in one spreadsheet hinders the further aggregation and inter-compatibility with similar data in databases for instance. The purpose of this information is to give advice how to setup spreadsheets best for transparent and integer data management.
The second part is devoted to formulas in Excel that are often hidden and a potential source of errors, which could be carried to other data sheets without knowing. Here we present way to make existing formulas transparent and to display the source cells involved in formulas.
Rules for better data organization in spreadsheets
Always be consistent
- consistent names for variables, e.g. for sex (
"male" "m" "Male" "M") or study ID ("mouse153" "M153" "M-153" "Mouse-153F"). Pick one and stick to it.
- consistent date format; preferably as 8-digit integer of the form
YYYYMMDDor the global ISO8601 standardYYYY-MM-DD
- consistent phrases in notes columns (
"dead" "deceased" "Dead" "tot") - check for hidden spaces in cells (
"male" "male " " male") - use hypens or underscores but not space in a cell (
MCAO_60min MCAO-60min) but avoid symbols that have meaning in programming languages ($ @ % # & * ! , / \)
Make sure that text stays text
- By default, Excel converts certain text entries into dates. This is problematic when using name of genes or transcripts, such as SEPT7 or OCT4. To avoid this:
- Select the column, row, or cell(s) in questionn
- in the Menu bar, select Formal --> Cells
- Choose "Text" on the left
Alternatively, especially when entering text manually, begin with an apostrophe 'SEPT7 Whatever you decide on, be consistent.
No empty cells
- use "
NA"or"-"for missing data - when repeating conditions or values occur in neighboring cells, fill each cell with that value
One information per cell
- for instance, specification of a
wellpostion on a certain cell culture plate - Do no use:"13-A01"instead have 3 separate columns"plate" "well_row" "well_coumn"with corresponding entries"13" "A" "1" - do not put value and the corresponding unit into cell like
"45 g". Either use column name such as"body_weight_g"or"body_weight"and define units in a data dictionary and have only the information"45"in the cell.
Data entries should be made in a rectangle (or set of rectangles)
- first row should start with cell A1 and only contain variable names, not more than one row for variable name
- if row with variables gets too long and complex, consider breaking them into logical bins of your study; e.g. one file for week1 outcome measures; one file for week2 outcome measures
- even though tempting to use multiple worksheets for data storage, use only one sheet per file, to permit easy and smooth conversion into comma-separated-value (CSV) files.CSV files are so generic that any spreadsheet program can open them and any data analysis program can import them.
- Use only raw data entries, no calculations such as means, SDs, or fold change
- do not use merged cells anywhere, even if one heading term like
"week 4"applies to subordinate columns"weight" "rotarod_run1" "rotarod_run2" rotarod_run3". Instead use conventions like"weight_w4" "rotarod_run1_w4" "rotarod_run2_w4" rotarod_run3_w4"
Create a data dictionary
- separate file that explains variables, ideally in in rectangular shape for better overview
- Data dictionary might contain (as headers):
- the exact variable as in data file
- version of variable name as might be used in data visualization
- a longer explanation what the variable means
- the measurement unit
- expected minimum and maximum values
- in addition always include a
ReadMetext file that gives an overview of the project and data or other descritptions that make data and project more accessible and understandable to others, or permanent link to where the project is pre-registered or published.
No calculations/analyses in raw data files
- instead add another column with an indicator variable, e.g.
"trusted"with valuesTRUE or FALSE
Use data validation to avoid errors when entering data manually
- to avoid data entry errors to control the type of data or the values that users enter into a cell
- Select the column
- in the menu bar, select Data-->Validation
- Choose the appropriate validation criteria you want to set:
- a whole number of range
- a decimal number in some range
- a list of positive values
- text but with a limit on length
Save data in plain files and backup
- keep a copy of the data file in plain text format, such as CSV.
- be aware that German operating systems use
;instead of,in CSV files. Conversions can easily be made in any text editor program (find & replace)
Transparency of formulas in Excel
Formulas in Excel cells are not transparent and therefore a potential source of hidden errors. The most common errors with Excel formulas include
- operational error of a formula
- using the wrong cell(s) in a certain formula
The following procedures are easy check mechanisms to avoid such errors.
Show formulas instead of values
- Click on the
‘Formulas’Tab in the ribbon - Click on the
Show Formulasoption - Upon clicking, all formulas in the worksheet will become visible.
- Click
Show Formulasagain to make the underlying calculated results visible again
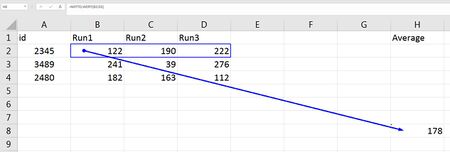
Show cells that are part of a a formula
- Select the cell containing the formula
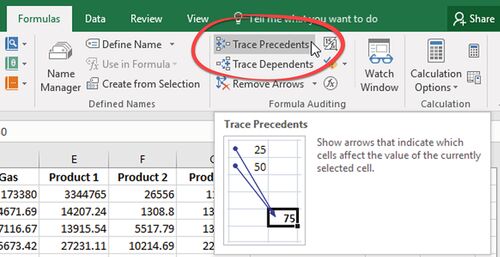
- Click on the
‘Formulas’Tab in the ribbon - Click
Trace Precedentsand all cells that are part of the formula are marked in blue and an arrow points to them. - Click
Remove Arrowsto turn off the tracing
References
1. Karl W. Broman and Kara H Woo Data organization in spreadsheets The American Statistician Vol.72, No.1, pages 2-10, 2018 https://doi.org/10.1080/00031305.2017.1375989
3. Hadley Wickham Tidy Data Journal of Statistical Software Vol 59 issue 10 (2014) 10.18637/jss.v059.i10 https://www.jstatsoft.org/article/view/v059i10


